Thanks to Hadley’s ggplot2 package, we are no longer confined to base graphics plots in R. However, by default all fonts are generated using the ‘Helvetica’ family. Now this is a great sans serif font, as evidenced by the fact that it is use literally everywhere in everything.
But now that we have these incredible graphical capabilities, and the ability to produce FiveThirtyEight quality figures, we should really explore how to enhance our plots further with the use of better fonts.
The gold-standard library for web developer fonts is Google Fonts. Designed for the web, these can be imported into any page and used to style the content. Unfortunately, as R users we have been confined for a while to using Winston Chang’s extrafont package to pull in any TrueType fonts from our local machine and use them to style our figures. While this works pretty well, for anyone with more than a few dozens fonts, the process of importing fonts becomes pretty tedious.
showtext
After spending some time trawling the web for a better solution, I stumbled across a github package by Yixuan Qiu called showtext. This neat little package allows users to install fonts directly from Google’s Font library with a single line of code. The result is plots that look like this:
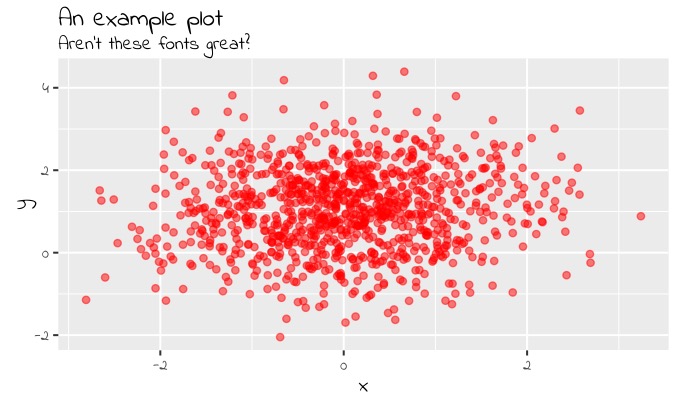
I used the following source code to generate the figure above. All credit to Yixuan Qiu’s showtext package for this.
    # Install the package direct from GitHub with devtools
    devtools::install_github("yixuan/showtext")

    # Load up the package
    require(showtext)
    require(ggplot2)

    # Download a wefont
    font.add.google(name = "Indie Flower", family = "Indie Flower", regular.wt = 400, bold.wt = 700)

    # name = the name of the font in Google's Library (https://fonts.google.com)
    # family = how you want to refer to the font inside R
    # regular.wt = the weight of font used in axis, labels etc.
    # bolt.wt = the weight of font used in the title

    # Perhaps the only tricky bit is remembering to run the following function to enable webfonts
    showtext.auto()

    # Generate some random numbers
    set.seed(123)
    x = rnorm(1000)
    y = rnorm(1000, mean = 1)

    # Throw them into a data.frame
    dat <- data.frame(x, y)

    # Put together out plot
    ggOut <- ggplot(dat, aes(x = x, y = y))
    ggOut <- ggOut + geom_point(alpha = 0.5, col = "red")
    ggOut <- ggOut + ggtitle("An example plot", subtitle = "Aren't these fonts great?")
    ggOut <- ggOut + theme(text = element_text(family = "Indie Flower"))
    ggOut